Rebuilt Course Progress Analytics for Courses
SMBcrm has rebuilt Course Progress Analytics to make course reporting faster and easier to use. The dashboard helps teams review course completion trends, spot learner drop-offs, and review individual learner progress from one place.
For teams using Memberships & Education, this update brings course engagement metrics, funnel reporting, member-level details, and export options into a single analytics view.
What changed
- A unified dashboard with filters for course and enrollment date
- Key metrics including completion rate, average progress, and time to complete
- Period-over-period comparisons for core metrics
- A learner journey funnel showing Enrolled, Started, and Completed stages
- A member progress table with enrollment, activity, completion, and session details
- CSV export for filtered reports, with email delivery for larger exports
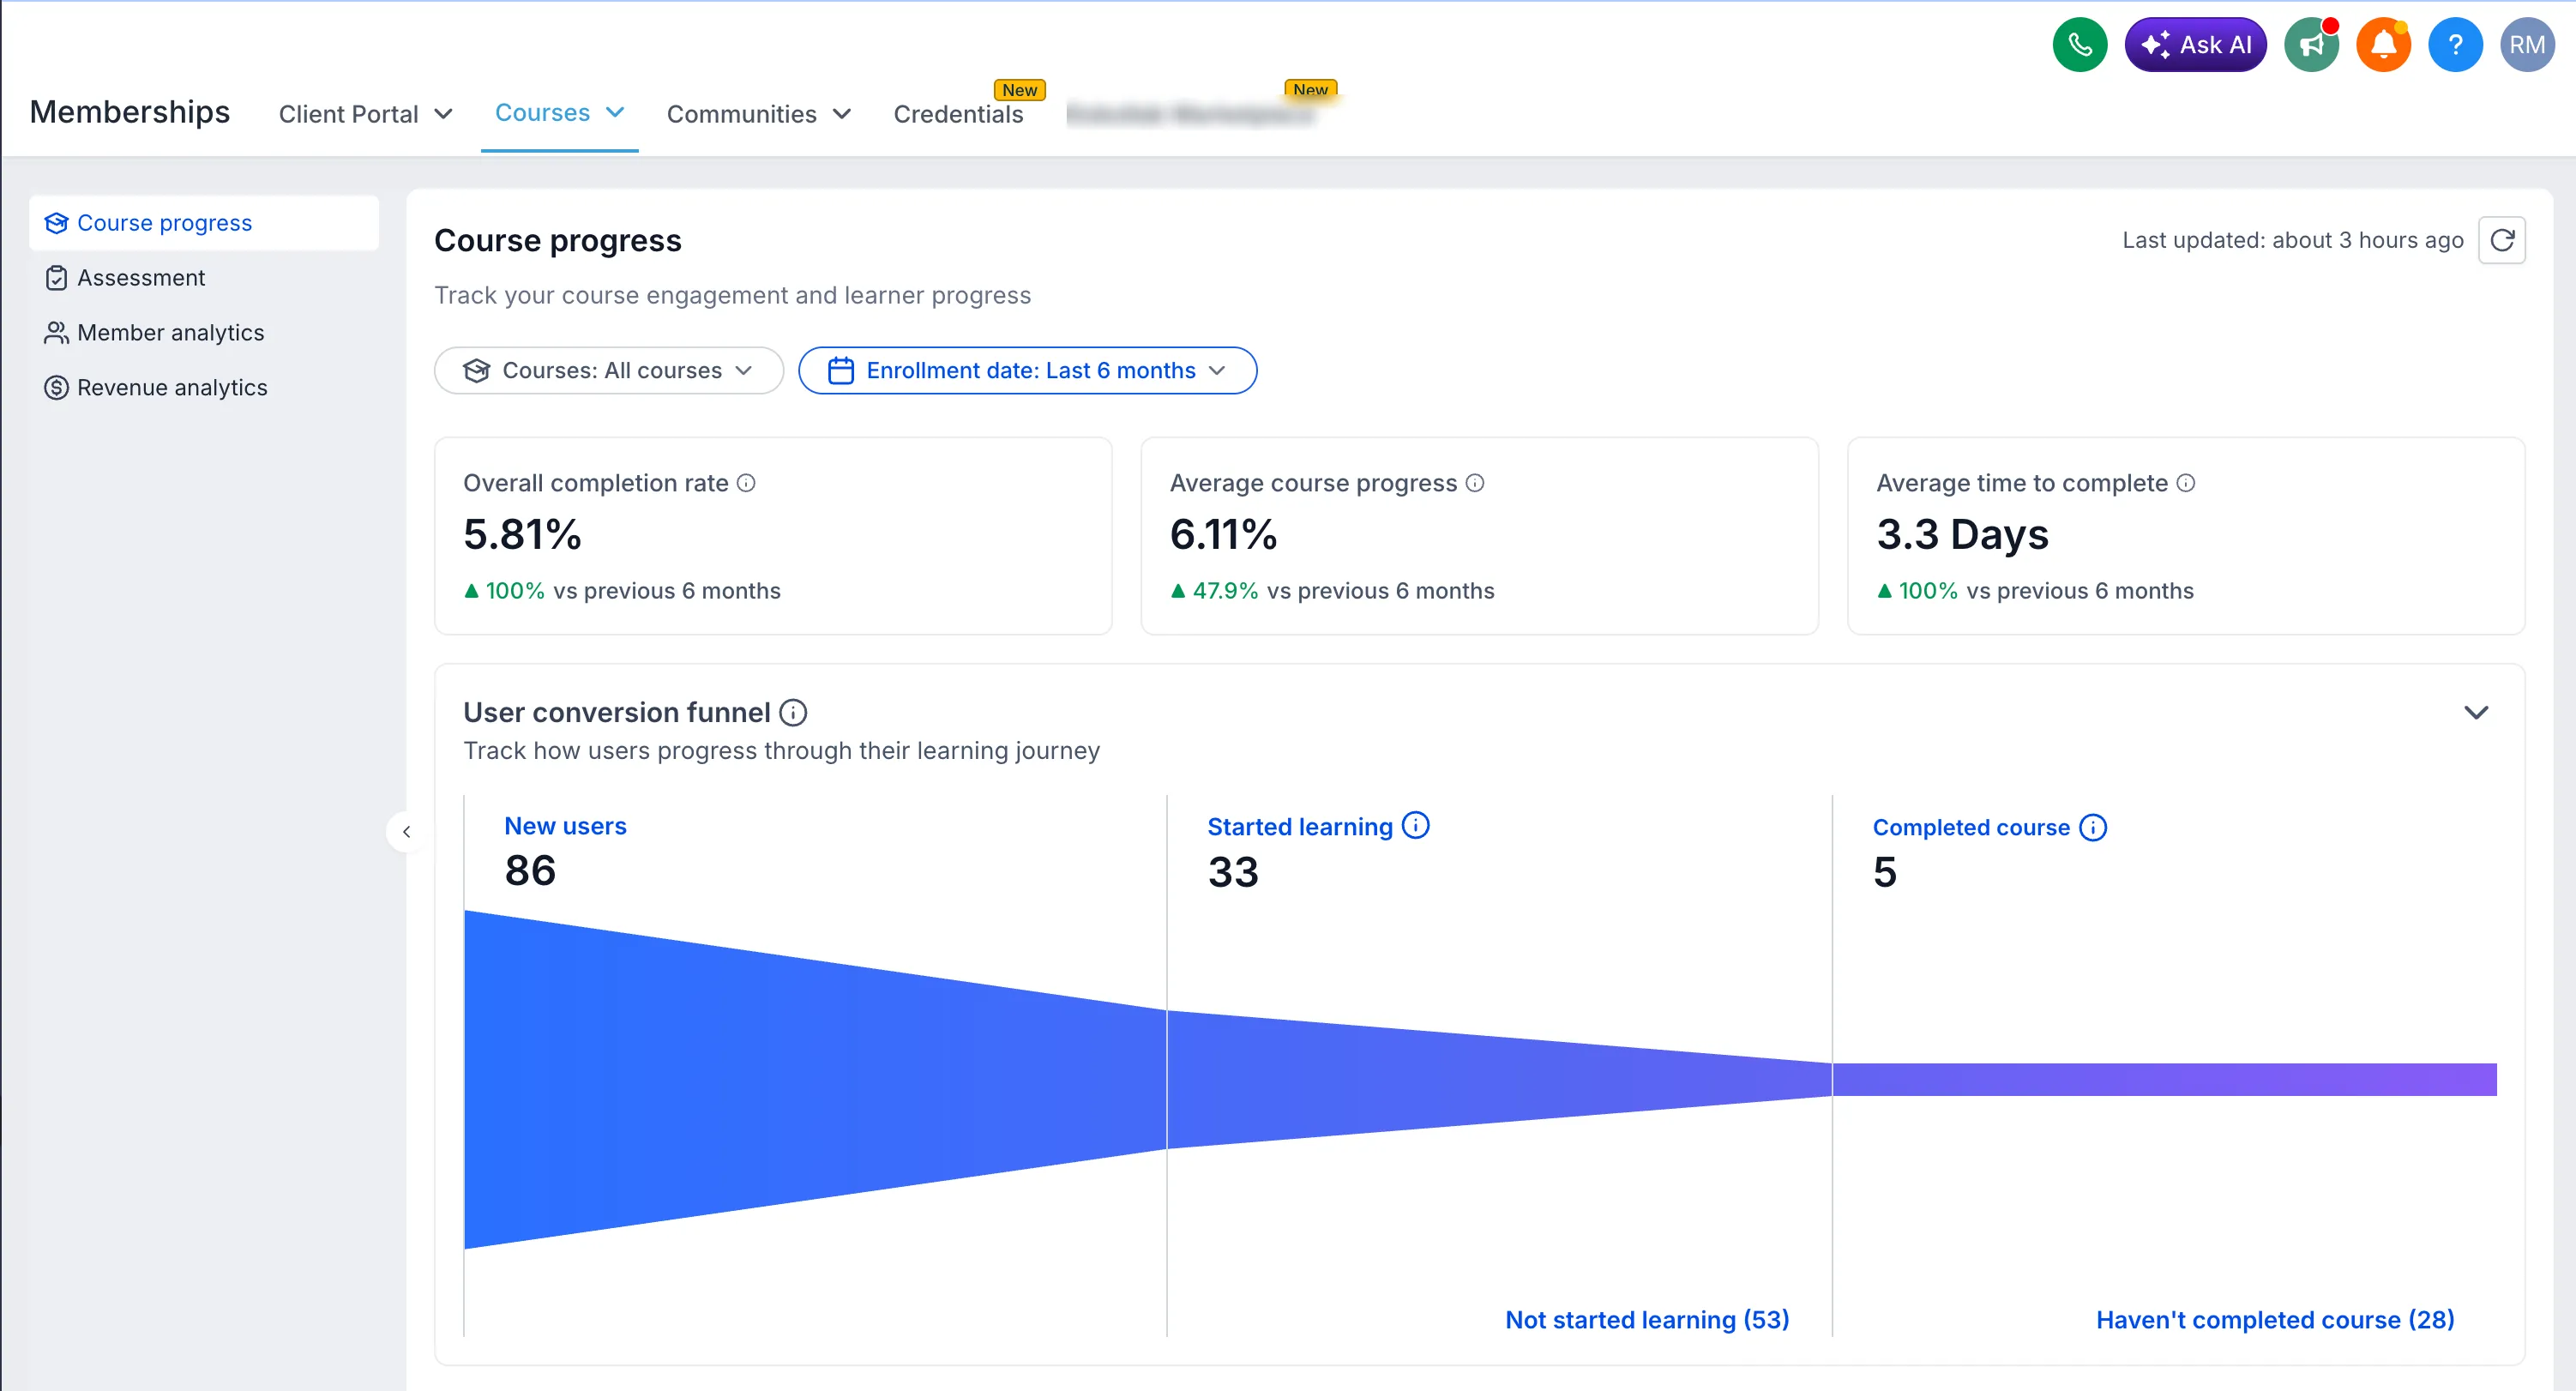
Faster reporting
The rebuilt analytics experience is designed for smoother reporting, with approximately 43% faster page loads and about 90% less data downloaded.
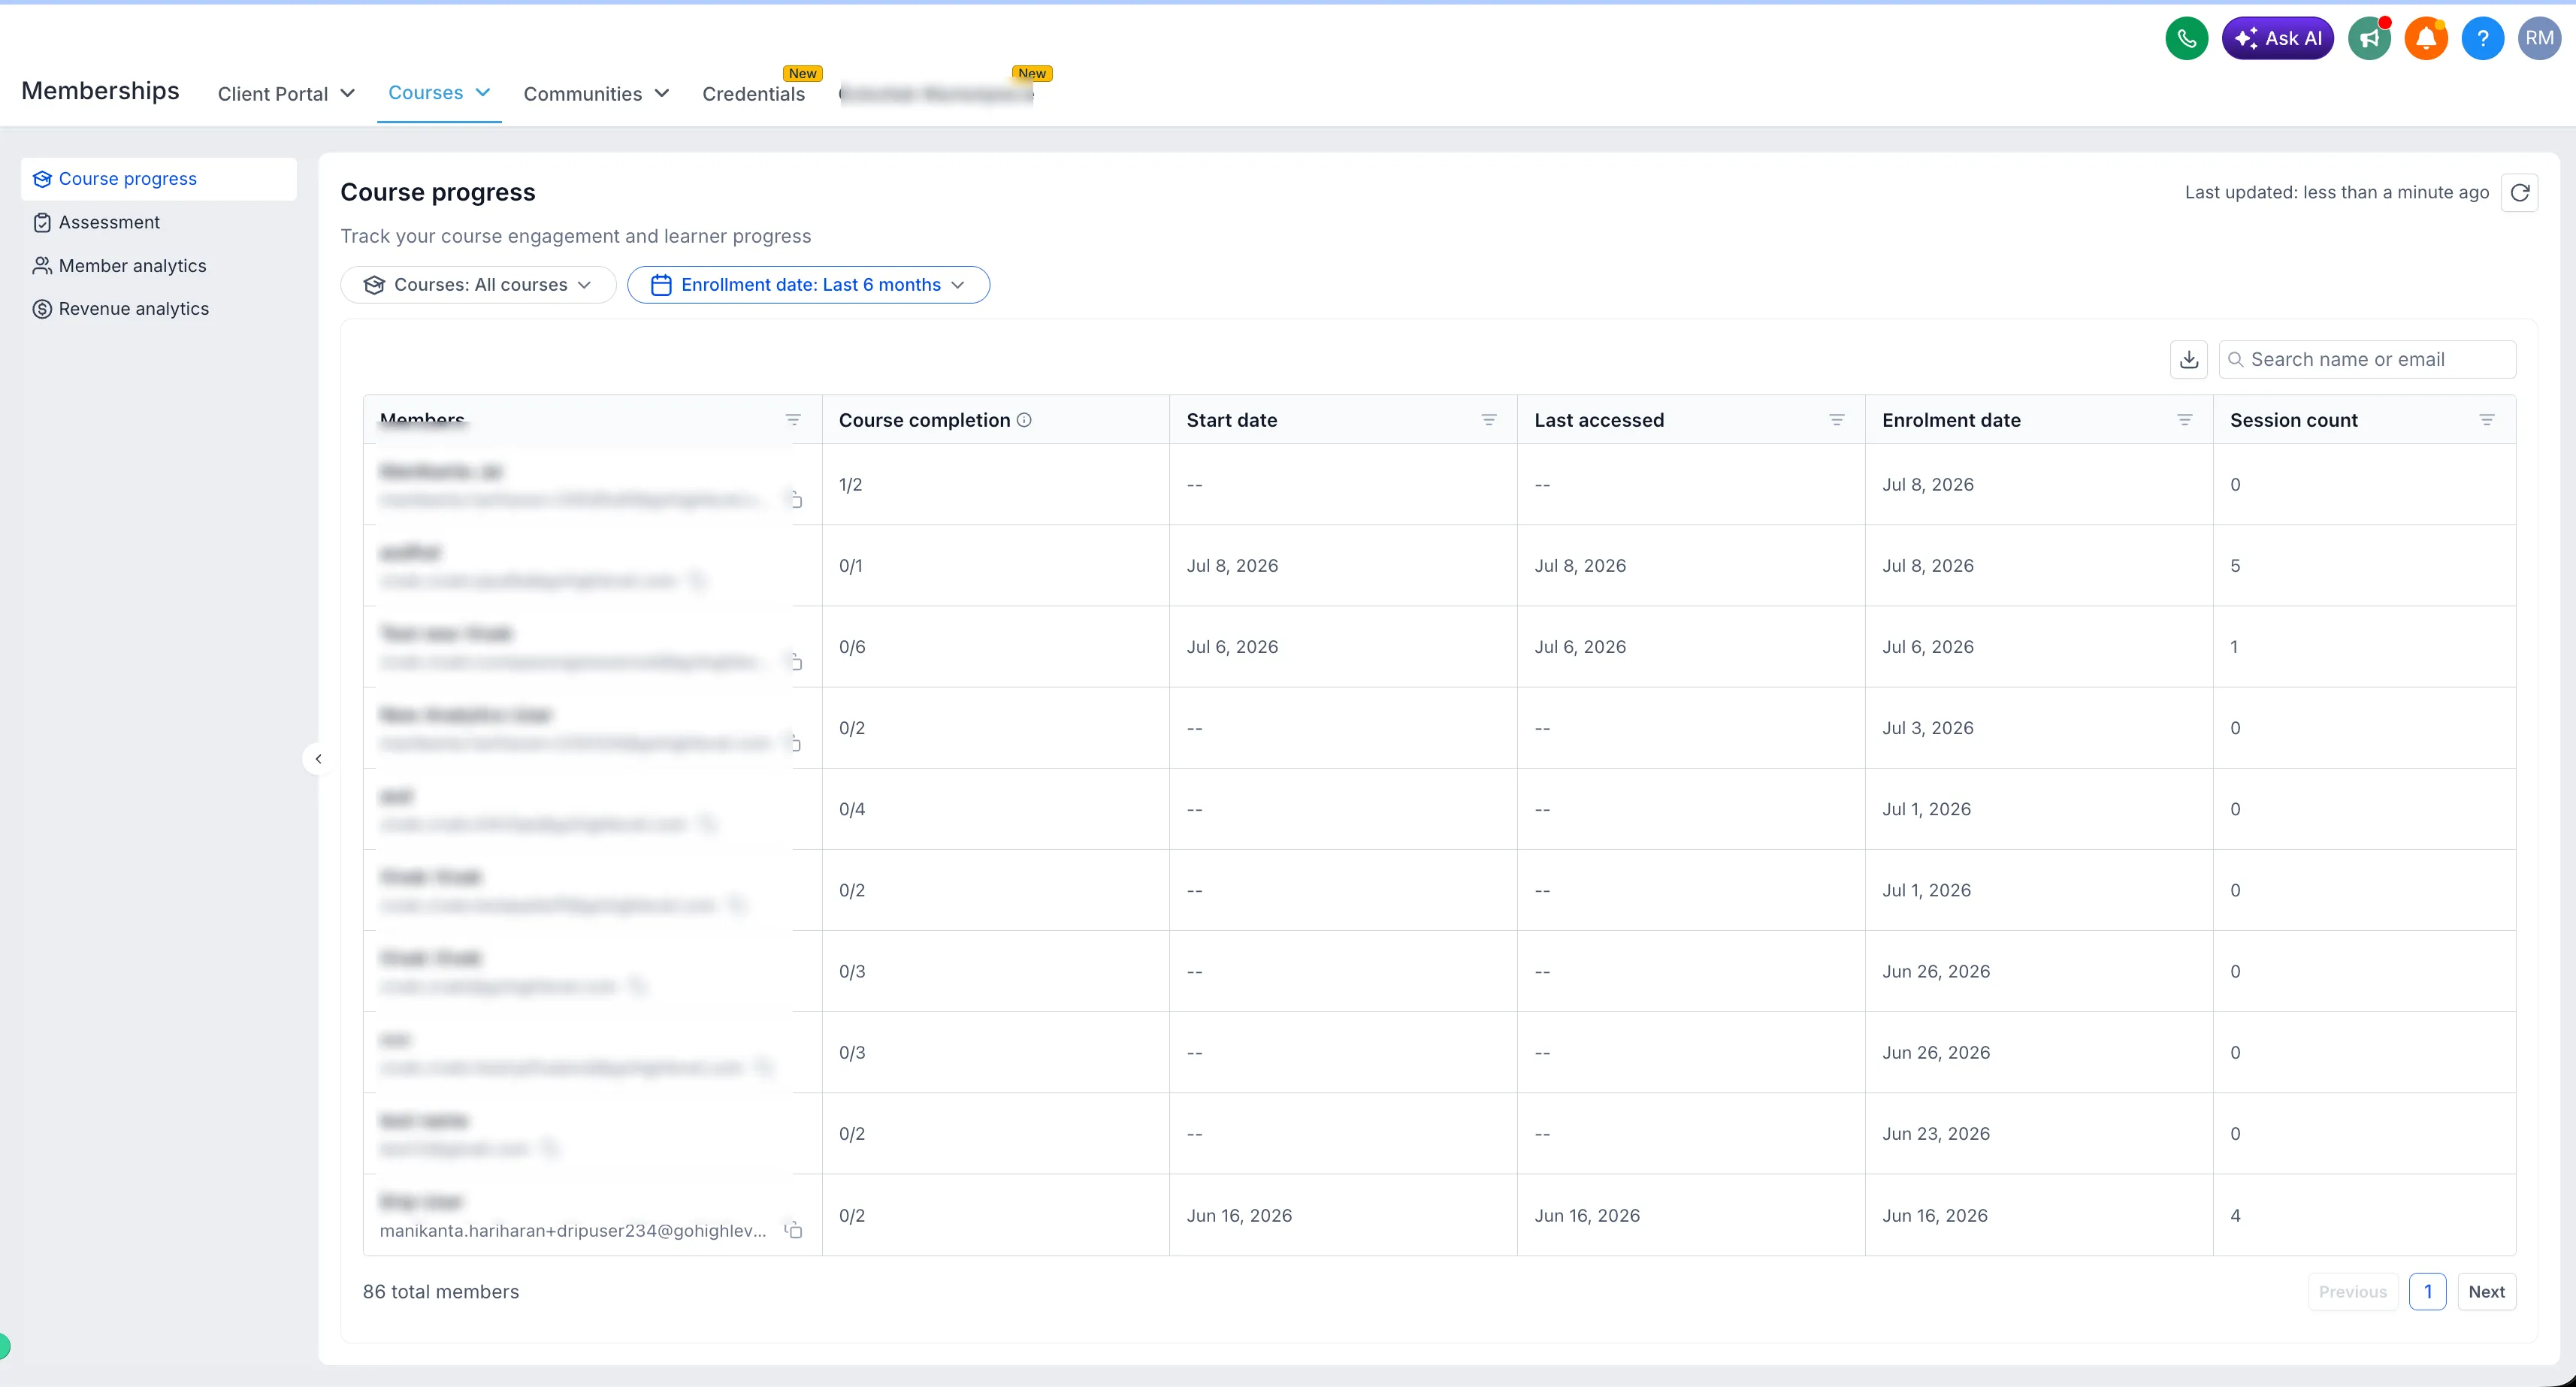
Why it matters
Course teams can use these reports to measure engagement, identify learners who may need attention, and make informed course improvements.
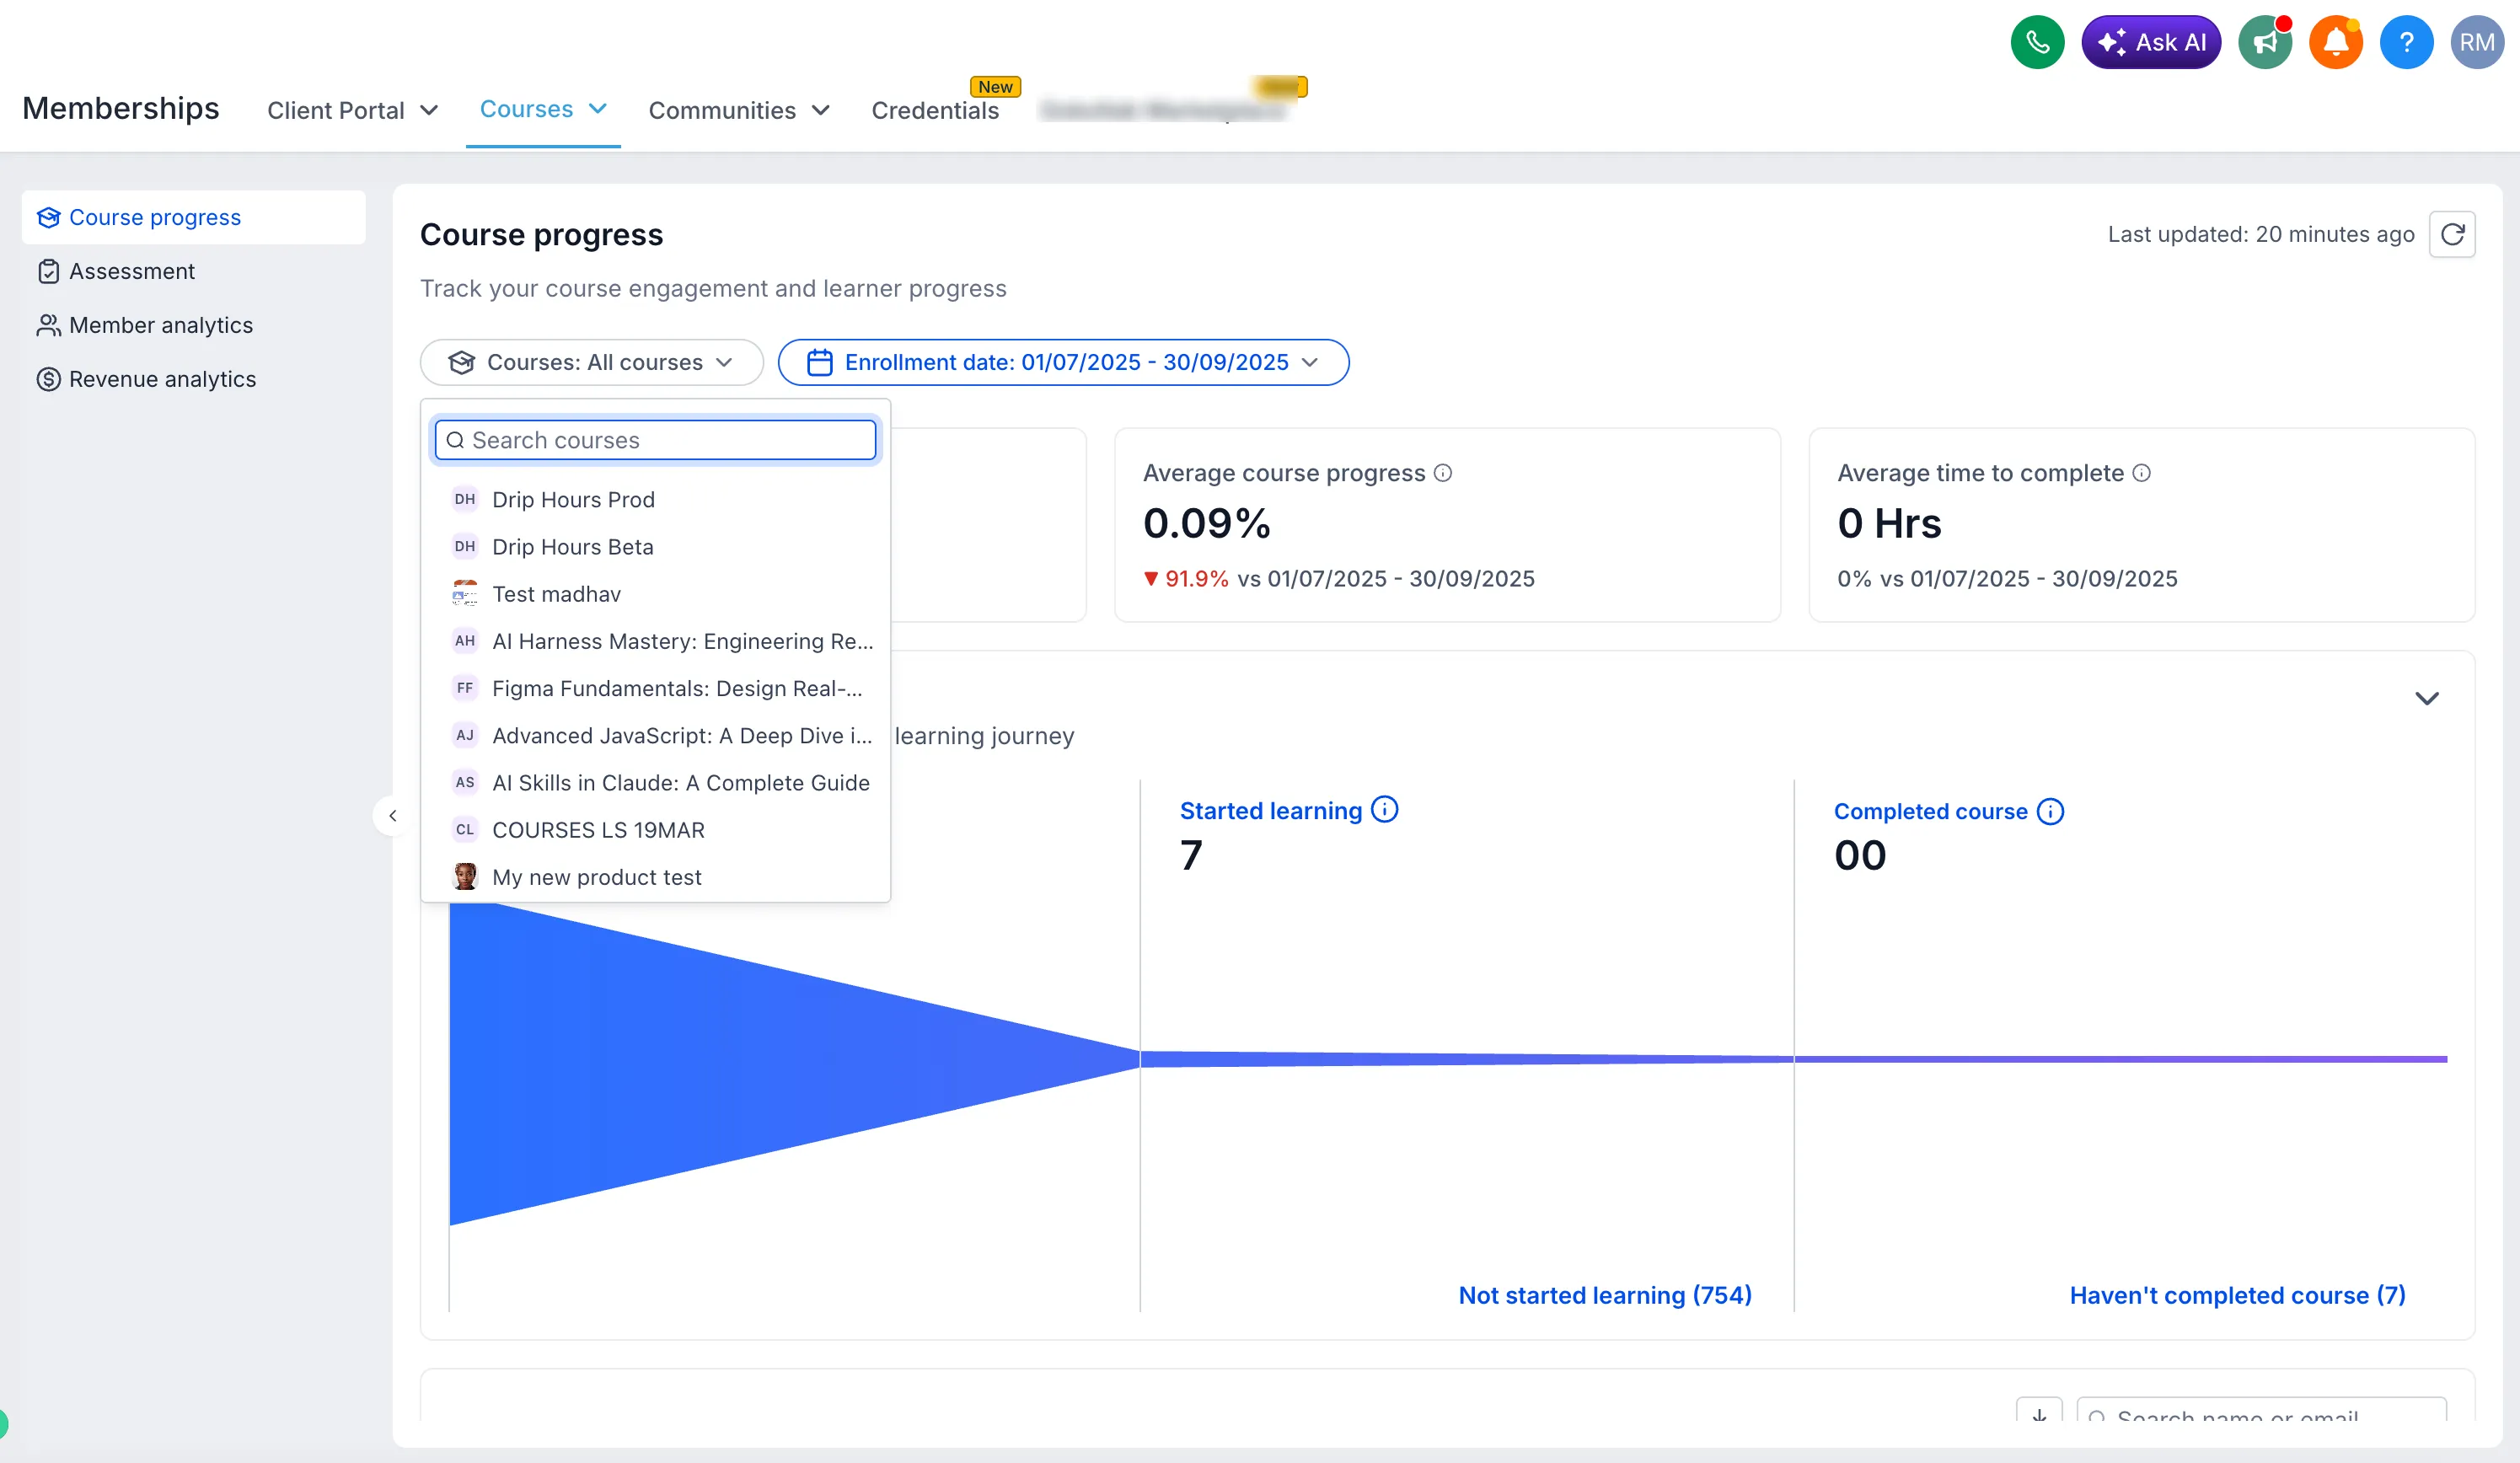
Availability
Enable New Course Progress Analytics in Labs, then go to Memberships > Courses > Analytics > Course Progress.
Coming next
Assessment Analytics and Revenue Analytics are listed as coming next for the Courses analytics experience.
Need Help Applying This Update?
Want help turning this update into a working part of your CRM, marketing, or automation setup?
Get Started or schedule a demo and we’ll help you map the right next step.